
Why Are Natural Gas Prices Below $2 this Winter?
Written by Catherine Elder
March 13, 2024
[Note: this is the first in a series of blog analyses of natural gas and electricity markets, authored by Aspen’s Energy Economics practice, directed by Catherine Elder.]
I get downright giddy when natural gas prices drop below $2 per MMBtu. Some 25 years ago, I came up with what I called the “Theory of $2 Gas,” arguing that there were enough proved and probable reserves to keep prices low for a very long time and that improvements in drilling techniques gave a marginal cost of production of about that range. One client laughed at me. Over the intervening years we’ve seen average prices much higher than $2, driven by large swings and periodic imbalances between production and demand, but somehow we come back to $2 every once in a while and every time I have to giggle.
Just why ARE prices so low right now? The U.S. natural gas market is winter peaking. Figure 1 gives U.S. gas demand by month back to 2001: winter demand is often 1.5 times larger than summer demand. In fact, in say, 2013 (which was the winter of the great “snowmageddon” enhanced by a series of cold temperature incursions stemming from a weakened polar vortex) winter demand looks more like 2.0 times higher, meaning winter demand was double that of summer. Virtually all of that increase from summer to winter gas use is heating demand. We inject gas into storage all summer long in order to make sure we have enough gas to get through winter. Prices traded for gas in forward markets reflect this pattern, too winter gas nearly always trades, in the forward market, for more than summer natural gas, and the spread is often more than simply the cost of storing the gas for a few months.

This winter, the expected peak never materialized and in fact demand looks to be lower than for any of the last five or six winters. Aside from that deep cold spell back mid-January, this El Niño winter has been warm all across the U.S. We can see this in the National Weather Service (NWS) heating degree data. Heating degree days (HDDs) are the difference, every day, between that day’s temperature and 65 degrees. The NWS data shows this winter (with February and March not yet reported) to be about10% warmer than normal. If you have been watching the weather, you know that February and March are not going to make up this deficit in cold days.
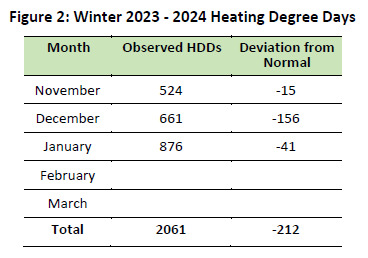
We looked further and obtained annual heating and cooling degree days for the contiguous U.S. Amazingly, this data goes back to 1895. The heating degree days show a distinct downward trend over the 125 years, with a lot of year-to-year variation. The average heating degree days over the 30 years ending in 2020 is 4,301, compared to 4,611 over the entire 125-year period. Climate scientists are increasingly using more recent periods to define “normal:” the heating degree days for the last ten years would give 4,179, which is about 5% lower than the 4,301 using the 30-year standard. Just the deviation we see for the three winter months reported in Figure 2, mean this winter is not normal.
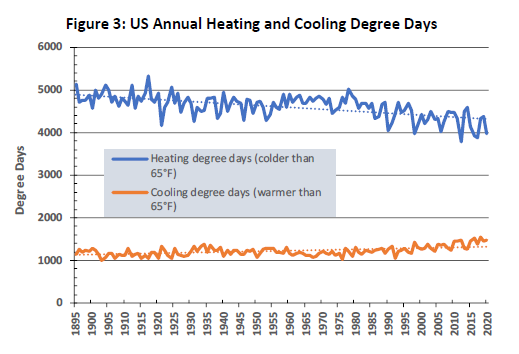
The same happens, but to a much smaller extent in summer. Notice how cooling degree days vary much more compactly than heating degree days. Cooling degree days are increasing, a trend that appears more prominently beginning around 1980 or 1985.
Factors on the supply side likely contribute to the current low prices, too. But it is quite common for prices to collapse when the expected winter cold fails to materialize.